

 Written by
When a municipality’s infrastructure collapses, the first casualty is public health.
The second is the truth.
What follows is a comprehensive, full-length investigative report.
The evidence documented here is dense, disturbing, and absolutely necessary to expose the reality on the ground.
We strongly urge every Galion resident to read it in its entirety, grasp the full scope of this crisis, and get involved.
If you have immediate concerns—or possess additional evidence that has been hidden from the public—reach out to Marion Watch directly.
We recently dismantled the regulatory shield protecting Galion’s wastewater treatment operations, exposing the deliberate paperwork games used by the EPA to coach the city with a goal of hiding a failing system from federal dashboards.
But this culture of engineered compliance is not a new tactic—it is a deeply entrenched history of toxins baked directly into the city’s legal and physical framework.
As Marion Watch recently reported on Galion City Watch, the administration actively maintained an outdated 1990 Sewer Use Ordinance designed to legally permit copper discharges in the local water supply at nearly five times the legally approved state limit.
When the water became too toxic to meet modern biological safety standards, the local political apparatus relied on antiquated local codes to simply move the legal goalposts rather than invest in fixing the physical infrastructure.
Now, we have uncovered direct, undeniable evidence of another layer of administrative shielding; this one is even more severe, and dates back to at least 2017.
In Galion, Ohio, a catastrophic intersection of industrial contaminants and failing treatment hardware has created a potential localized health emergency.
Behind closed doors, the EPA and city officials have documented a total physical collapse of the water treatment plant. Official records confirm that core treatment components have completely failed or severely corroded, including both clarifiers, the lime slaker, and the recarbonation influent valves.
Hazardous chemicals have been held together by band-aids; the city’s ferric chloride and caustic soda bulk tanks actively leaked, forcing the use of temporary storage totes.
The physical decay extends far beyond the storage tanks. As previously reported on marionwatch.com/galioncitywatch, an engineering company assessment cited that 80 percent of the massive Inflow and Infiltration (I/I) overloading the system is likely stemming directly from city-owned infrastructure.
It is also important to note that despite the city claiming the I/I testing will resume, we have seen no evidence of further testing.
This systemic collapse is further corroborated by whistleblower and former Superintendent Patrick Hickman, who went on record stating that the Water Treatment Plant is actively sending ferric acid and other corrosive chemicals directly to the Wastewater Treatment Plant, effectively destroying it from the inside out.
This interconnected, cascading failure casts a devastating shadow over the city’s water monitoring results. Later in this report, we will dive into the most recent lead tests, which expose the absolute improbability that individual house lines are to blame for the city’s toxic spikes.
When an extreme 51 µg/L lead exceedance triggers at the home of an independent, licensed local plumber, it is highly improbable that his private residence is not up to code.
Instead, all evidence points directly to the corrosive reality of the city’s own decaying infrastructure—a suspicion compounded by the fact that the city has been utilizing an insider-padded test baseline to artificially shield their numbers, carrying that rigged pool right into the present day.
But the true scandal is the now-proven cover-up.
The unredacted receipts, actively being compiled by Marion Watch, are now being explained in full context to the public.
In the hands of seasoned investigators, this leaves regulators with absolutely no way out, and no more room to maneuver.
The evidence proves that the EPA is most likely complicit in yet another coordinated paperwork game, actively facilitating the bureaucratic loopholes and cover-ups that obscure this four-decade decay.
This is a joint operation prioritizing administrative loopholes and politics over human safety—and they are finally out of places to hide.
This must, and will be fully exposed, and it MUST CEASE IMMEDIATELY.
THE “UNKNOWN” LIE AND THE MAP CONTRADICTION
To execute a federally compliant water testing program, a utility system must target high-risk homes with known lead infrastructure.
Galion, however, claims to be operating blind.
In a mailing distributed to residents in 2025 and sent to Marion Watch, the administration dispatched official Service Line Inventory Material (SLIM) notices classifying the city’s pipes as “Lead Status Unknown.”
The city formally declared: “We have been unable to confirm the material of your service line at this time.” With that single sentence, the administration washed its hands of immediate physical repairs, telling residents they had no “scheduled opportunities” to replace hazardous lines.
This was not administrative incompetence.
It was a documented fabrication.
2025 UNKNOWN LEAD SERVICE LINE LETTER (CLICK TO ENLARGE)
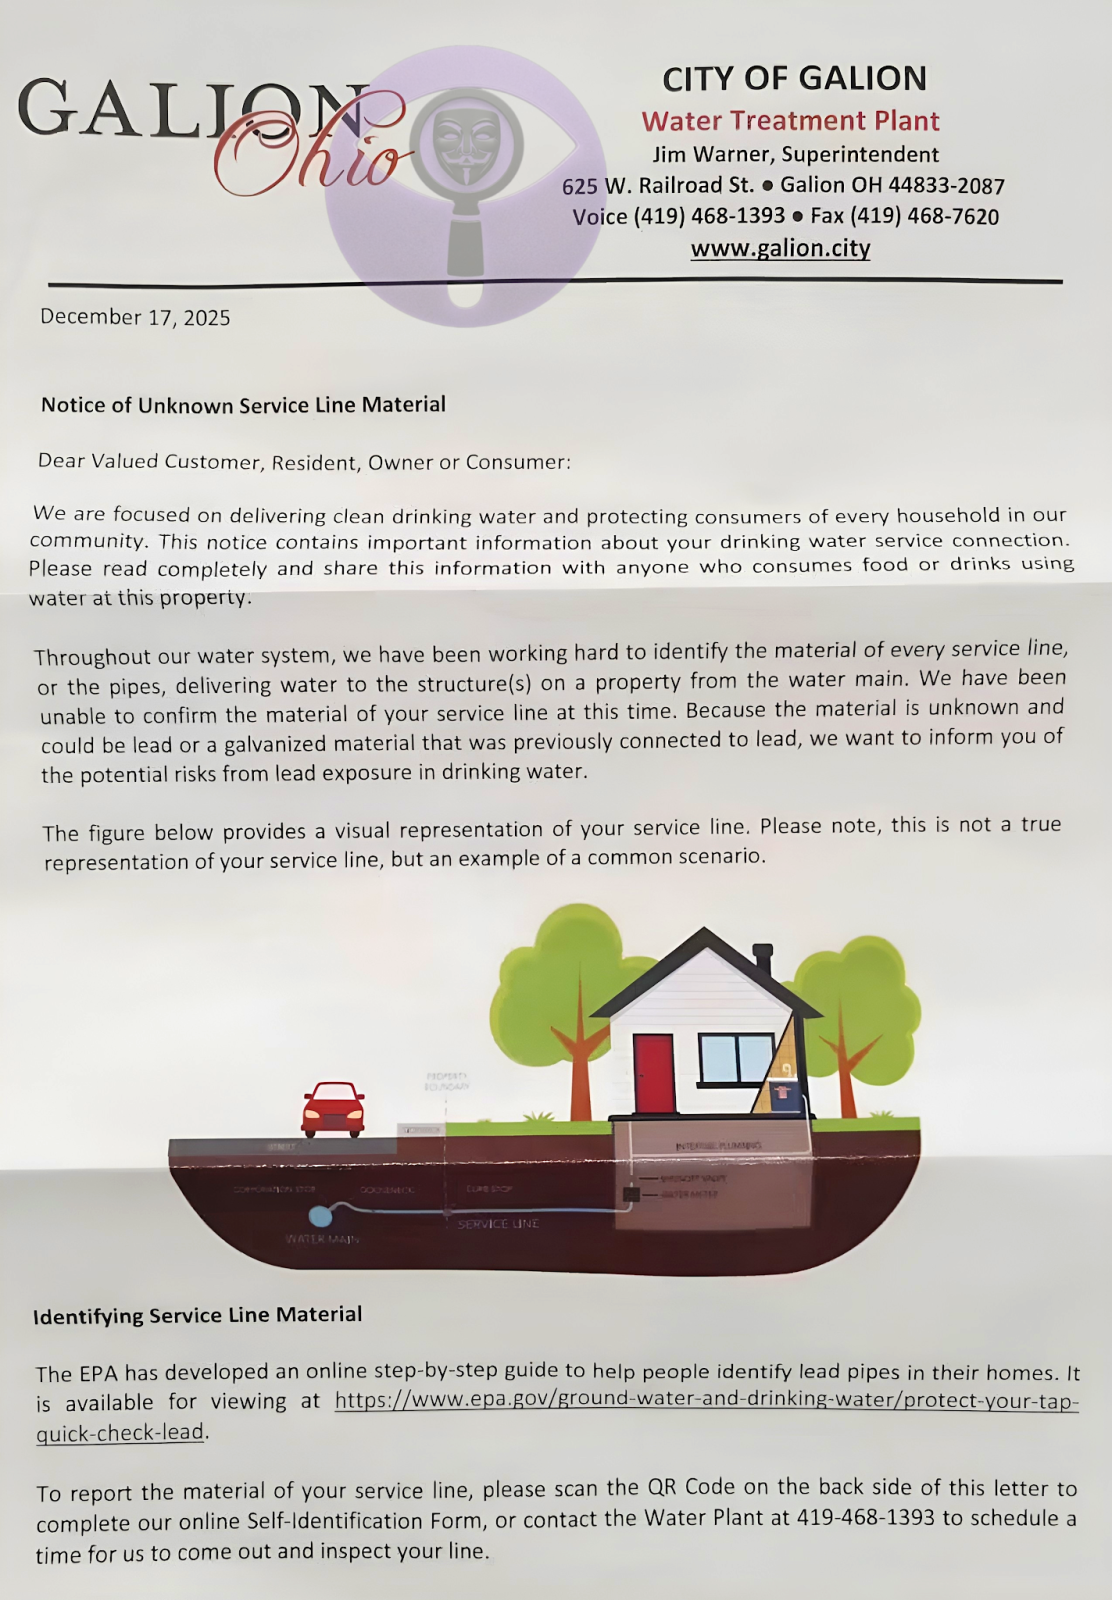
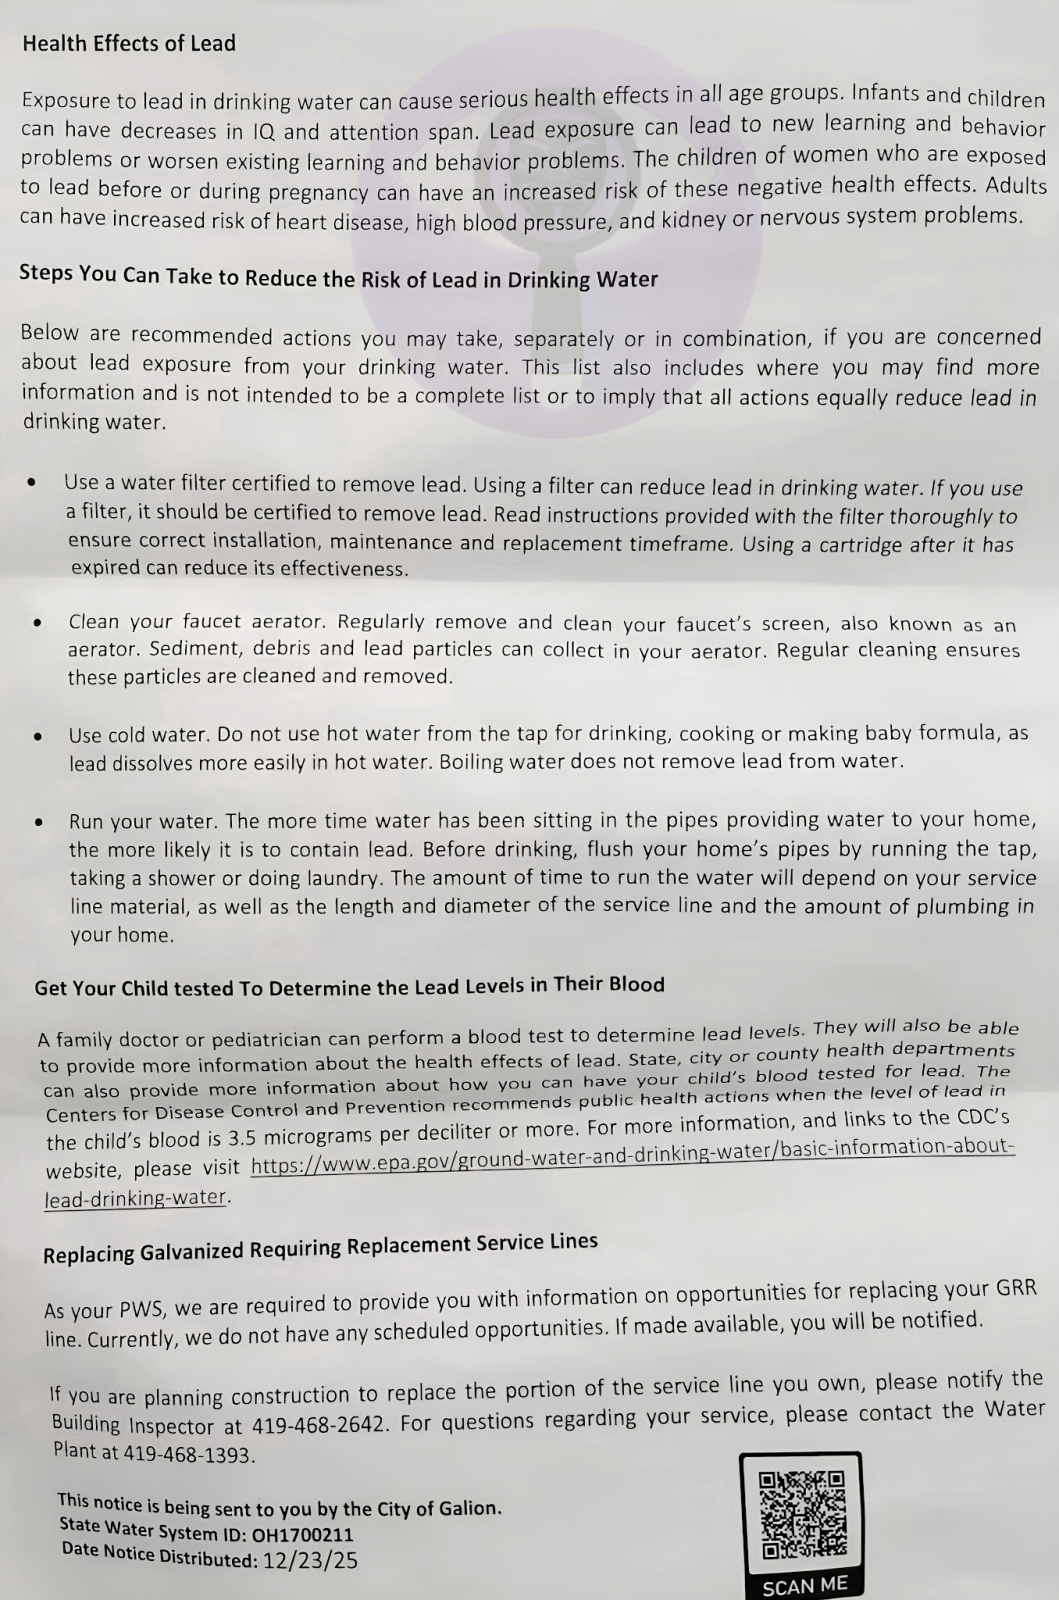
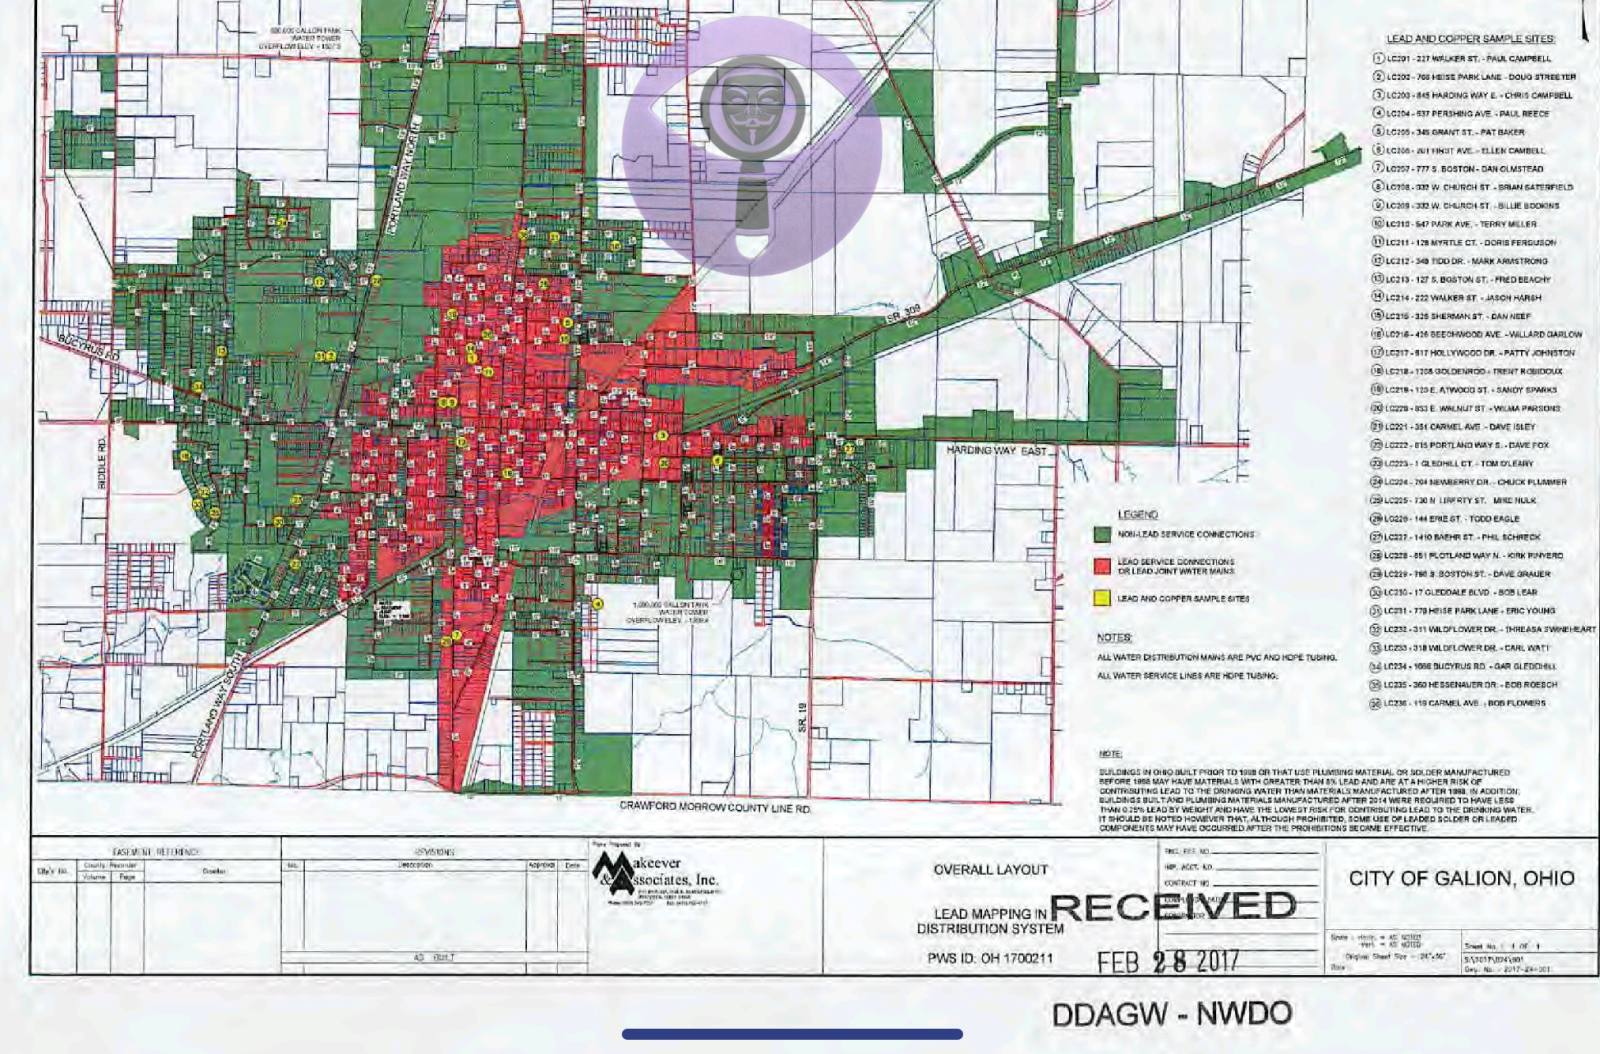
Internal maps from 2017 expose exactly how the city manipulated the public record.
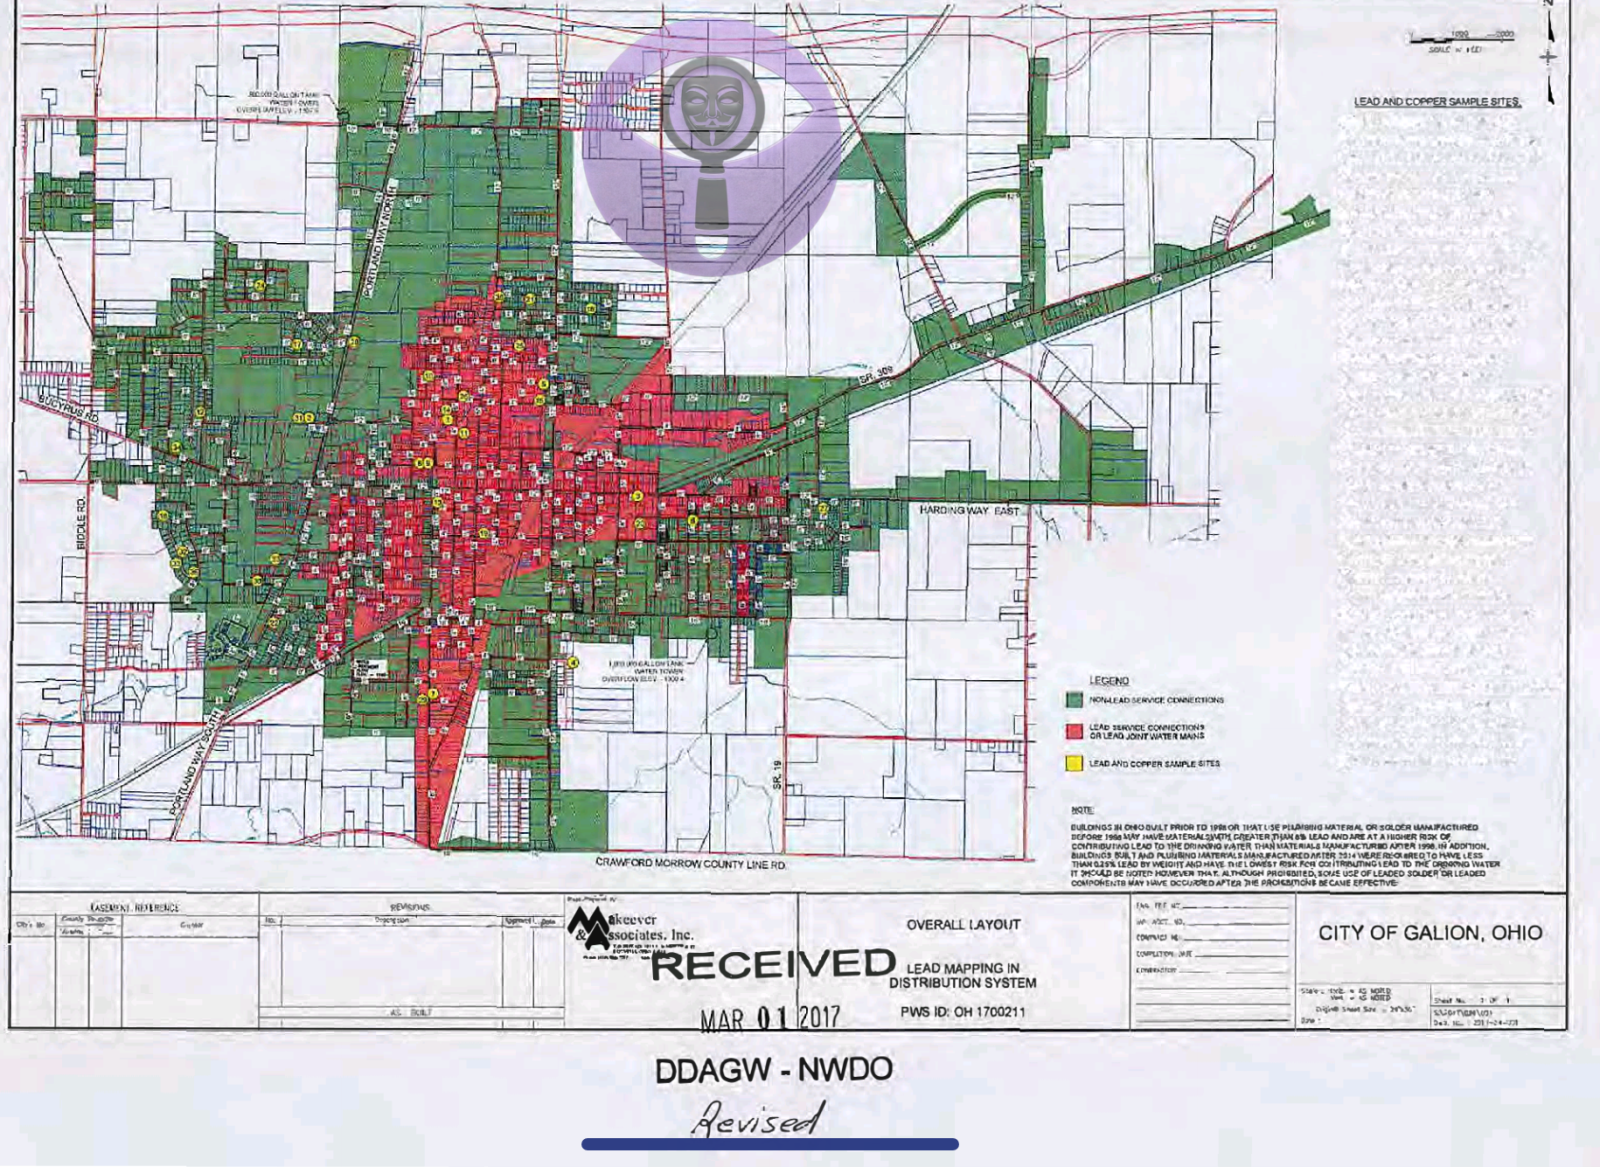
On the city’s initial February 28 “Overall Layout Lead Mapping in Distribution System,” a specific sidebar cataloged 36 designated “Lead and Copper Sample Sites”.
This was not a random sampling; it was a precise, address-by-address blueprint of the city’s known lead infrastructure, complete with the names of the property owners.
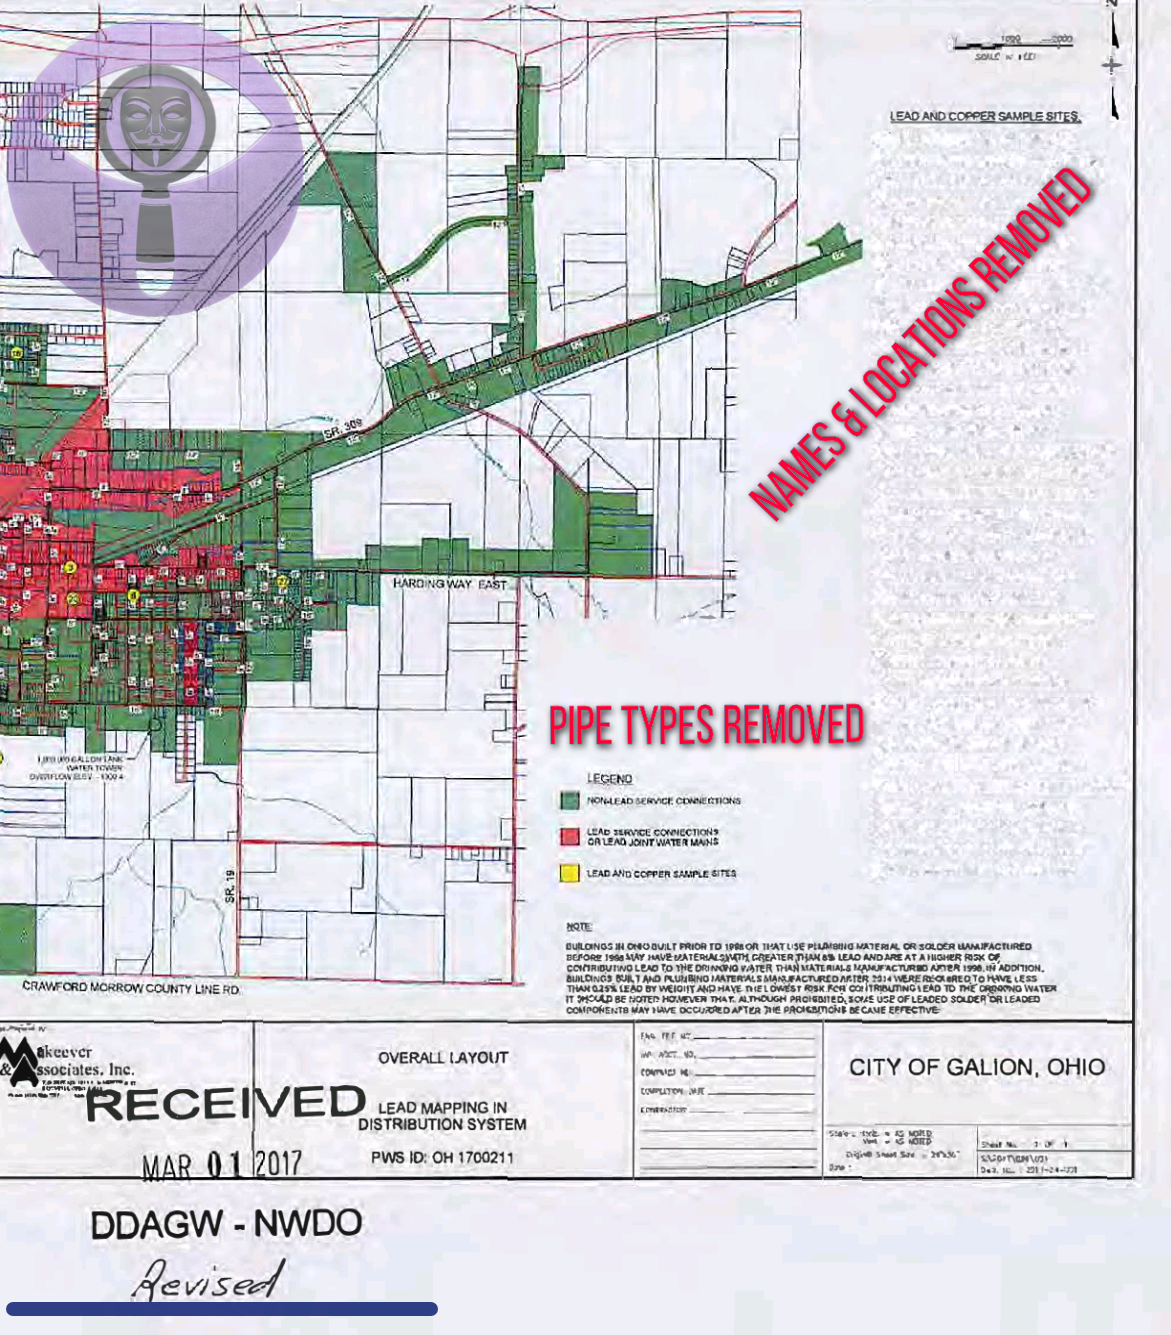
Just 24 hours later, Galion submitted a “Revised” map.
The red and green shaded utility zones remained, but the city completely erased the 36-site sidebar, bleaching the names, addresses, and known testing locations into a blank white space.
They didn’t just erase the names; they erased their own engineering lies.
The initial February 28 map contained a formal “Notes” section claiming all water mains and service lines in the city were made of modern PVC and HDPE plastic—a mathematically impossible claim for a city with legacy infrastructure dating back a century.
By March 1, the city had deleted that note entirely.
But before they bleached the master list, that unredacted sidebar explicitly exposed the home addresses of city employees and other political insiders.
The contradiction is devastating.
When the city mailed notices to residents in 2025 claiming their service lines were “unknown,” they were actively lying.
They had possessed a highly detailed, address-specific map of the lead lines for eight years, and they were actively using it to cherry-pick their testing pool.
A practice that we have proven continues to this day.
THE RECEIPTS: THE INSIDER TESTING ROSTER
The scope of this engineered compliance is fully visible when cross-referencing the city’s current EPA compliance cycle against their 2017 master testing map.
For thoroughness, we traced these specific Location Codes (LC) across nearly a decade of records.
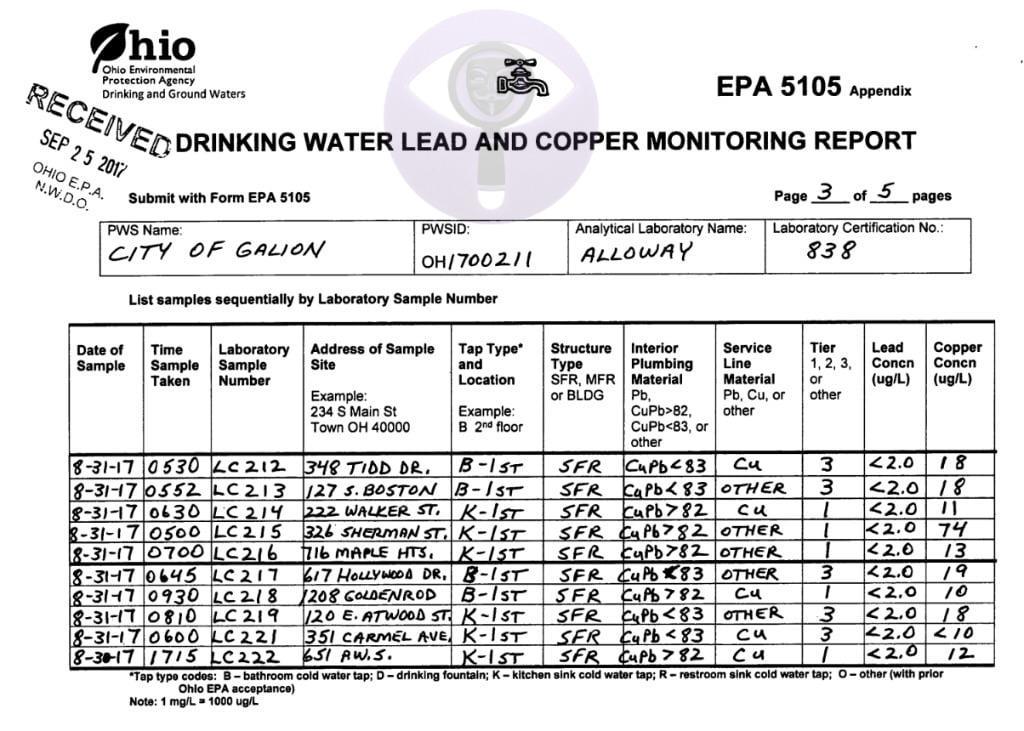
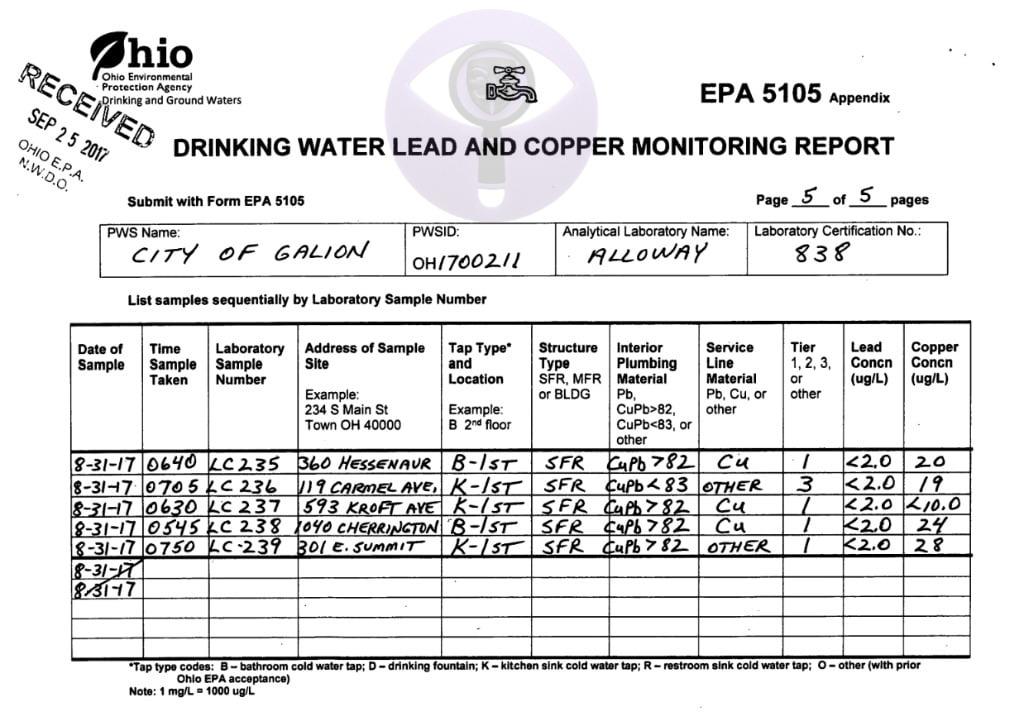
We tracked them from the initial unredacted February 2017 map, through the official Lead and Copper Monitoring Report submitted to the Ohio EPA in September 2017, and directly into recent Verification of Lead Consumer Notice forms submitted for the 2025/2026 compliance cycle.
The records confirm an unbroken chain of recycled test sites: the city bleached the names from the public map in March 2017, but officially tested those exact insider taps months later, and then explicitly certified on recent EPA forms that they are still testing those same locations today.
THE “CLOSED-LOOP” TESTING POOL (REPEATED FROM 2017 TO PRESENT)
These specific locations demonstrate how the city deliberately utilizes municipal employees, their families, and elected officials to anchor their safety data.
By repeatedly recycling the same safe addresses, the city mathematically dilutes any actual toxic spikes to stay under the 10 percent federal threshold.
FEBRUARY 28, 2017 (ORIGINAL MAP)
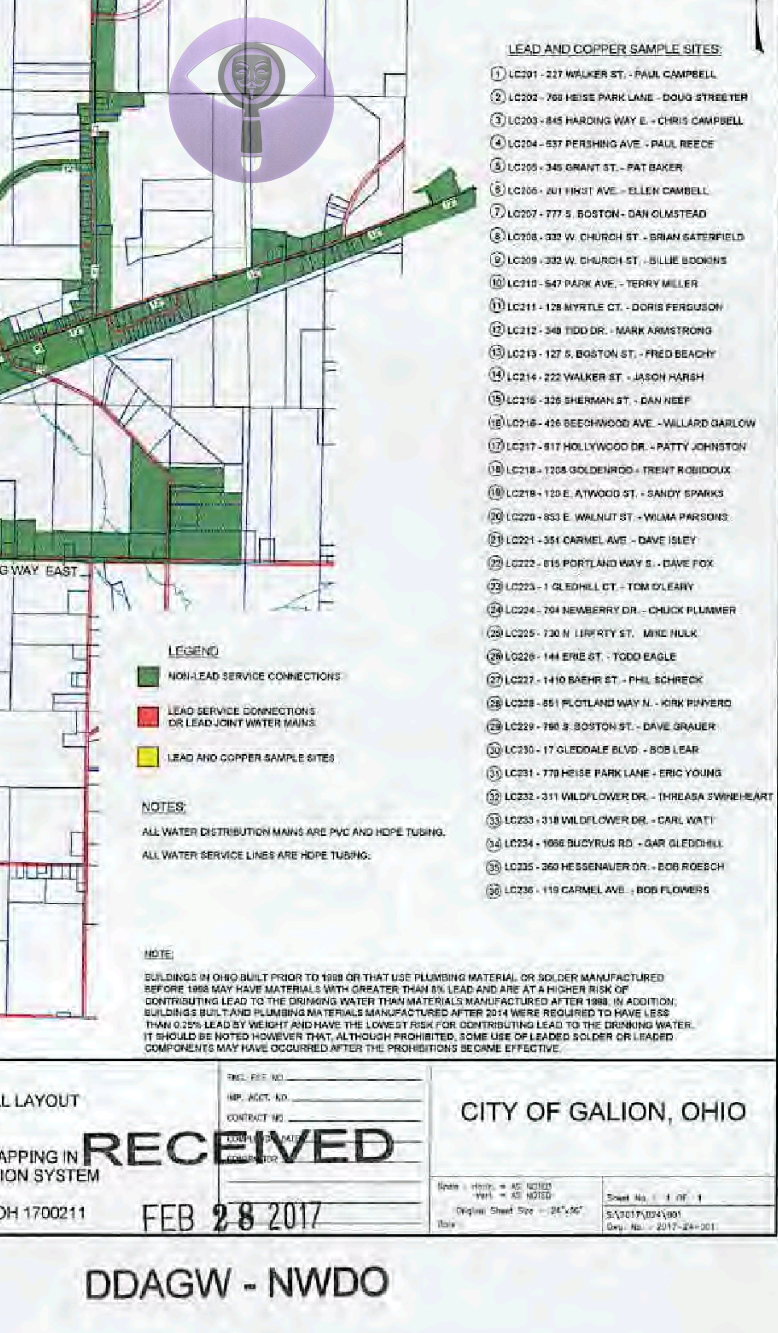
MARCH 1, 2017 (REVISED Map)
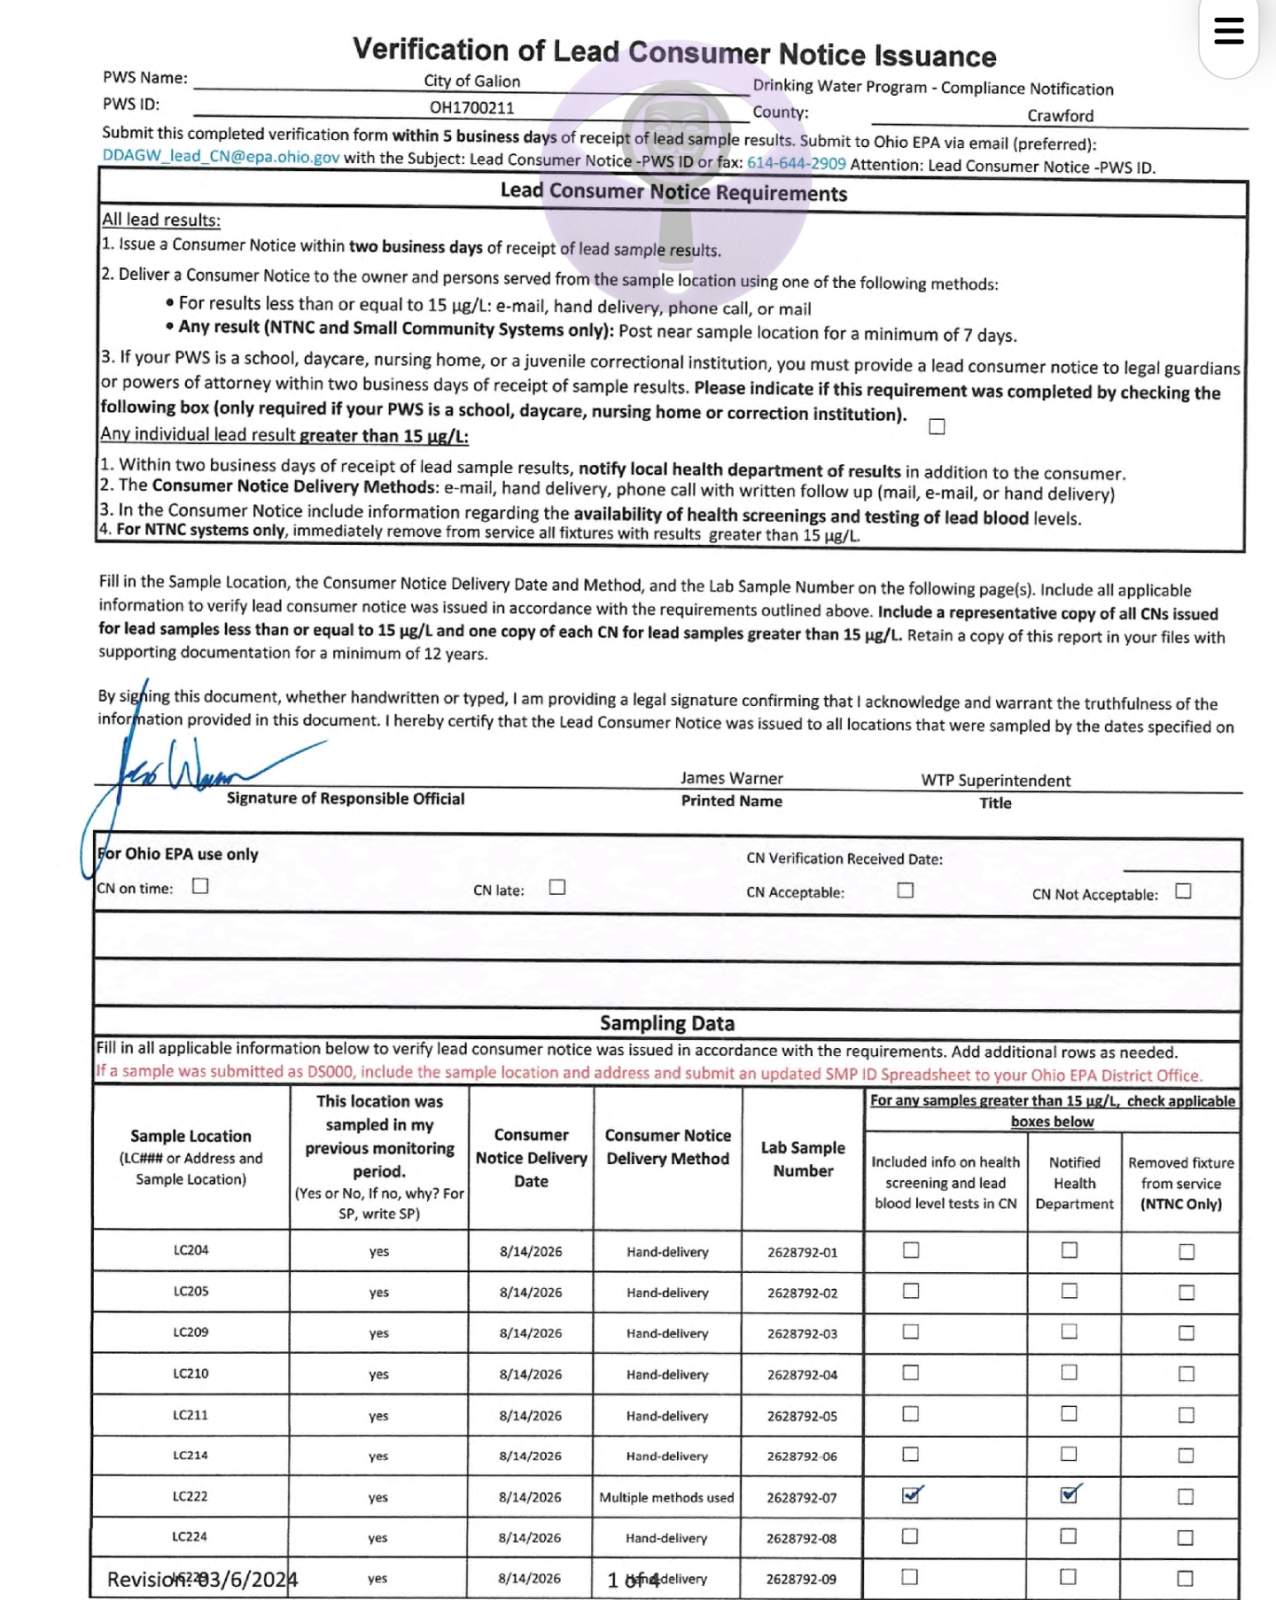
Official EPA verification forms from both tests in 2017, September 2025 and August 2026 explicitly list these location codes, with the city checking the box confirming “Yes,” these exact addresses were sampled in the previous monitoring periods:
- (LC209) W. Church St.: Listed on the unredacted 2017 map as the residence of Billie Bodkins. Public records confirm Bodkins is a direct family member of Renee Bodkins, the current Superintendent of the Galion Wastewater Treatment Plant as of May of 2026. Tested in 2017 (used twice), 2025, and 2026 (used twice).
- (LC202) Heise Park Lane: Listed on the Feb 2017 map as the residence of Doug Streeter, the Lab Tech for the Galion Water Treatment Plant. Tested in 2017 (used twice), 2025, and 2026 (used twice).
- (LC210) Park Ave.: Listed on the Feb 2017 map as the residence of Terry Miller, a Motor Equipment Operator for the Galion Service Department. Tested in 2017 (used twice), 2025, and 2026 (used twice).
- (LC226) Erie St.: Listed on the Feb 2017 map as the residence of Todd Eagle, the Captain and Fire Inspector for the Galion Fire Department. Tested in 2017 (used twice), 2025, and 2026 (used twice).
- (LC204) Pershing Ave.: Listed on the Feb 2017 map as the residence of Paul Reece. Tested in 2017 (used twice), 2025, and 2026 (used twice).
- (LC222) Portland Way S.: Listed on the Feb 2017 map as the residence of Dave Fox, a well respected resident and owner of a local Galion plumbing business. Tested in 2017 (used twice), 2025, and 2026 (used twice). (This is the site of the massive 51 µg/L toxic lead spike—a spike that was successfully mathematically diluted by the rest of this repeated insider testing pool).
LEAD TESTS 2017/2025
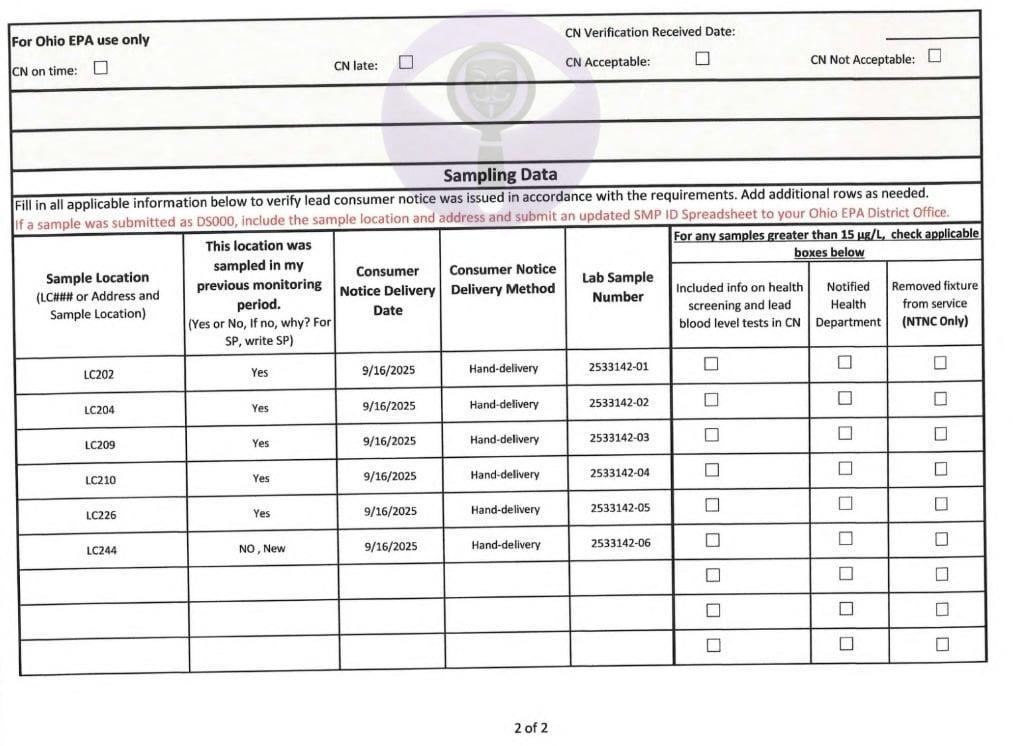
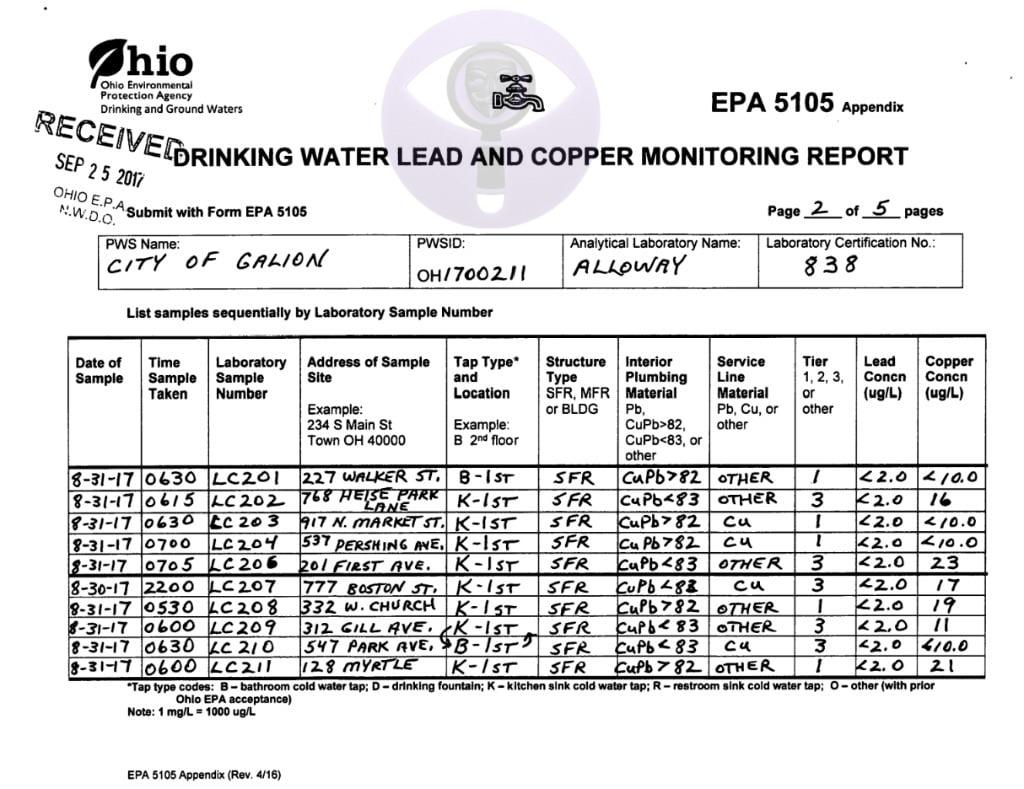
LEAD TEST #1 AUGUST 2026
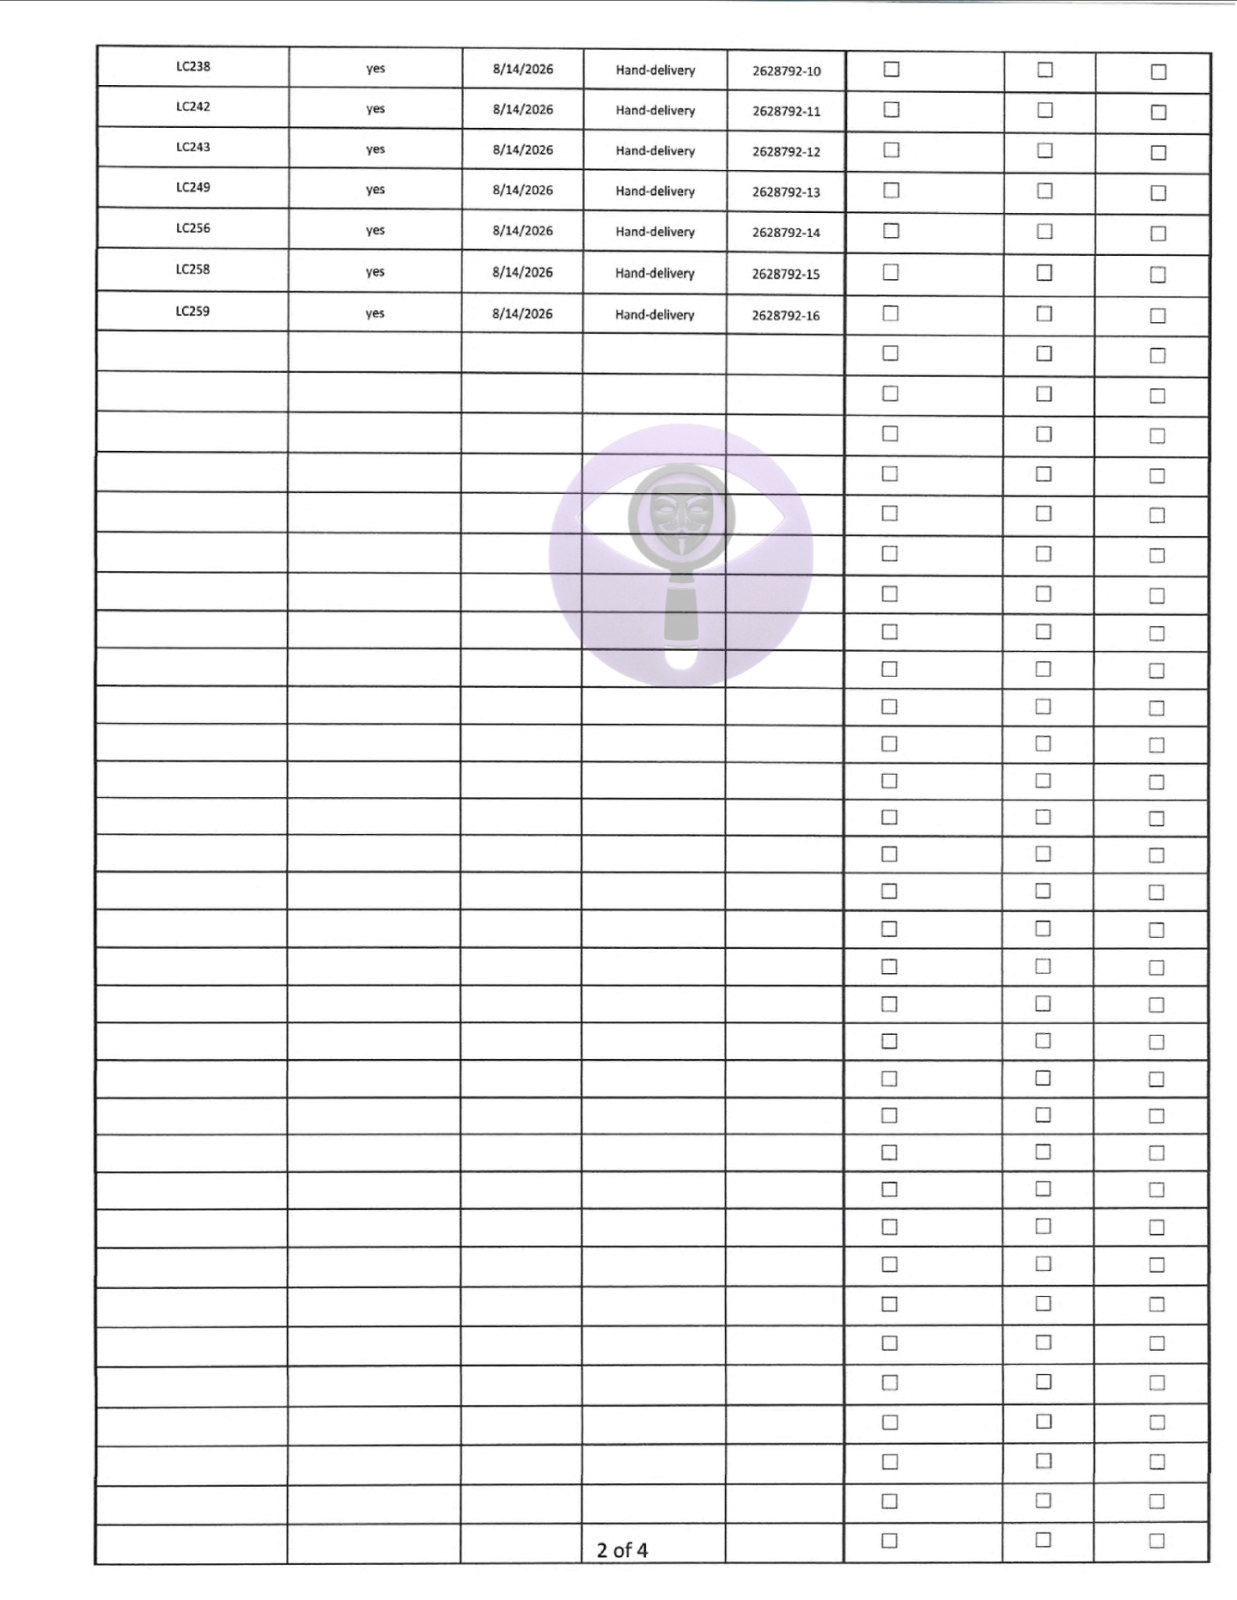
LEAD TEST #2 AUGUST 2026
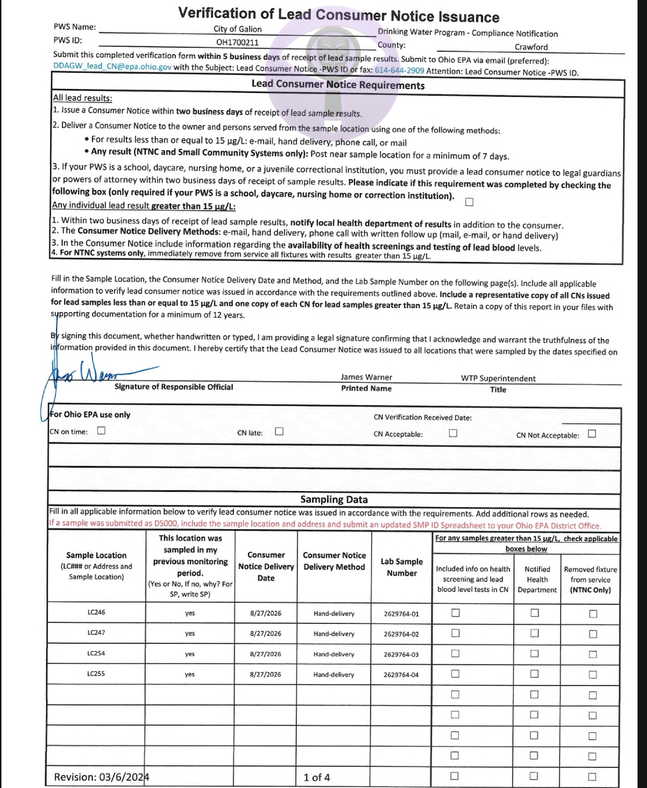
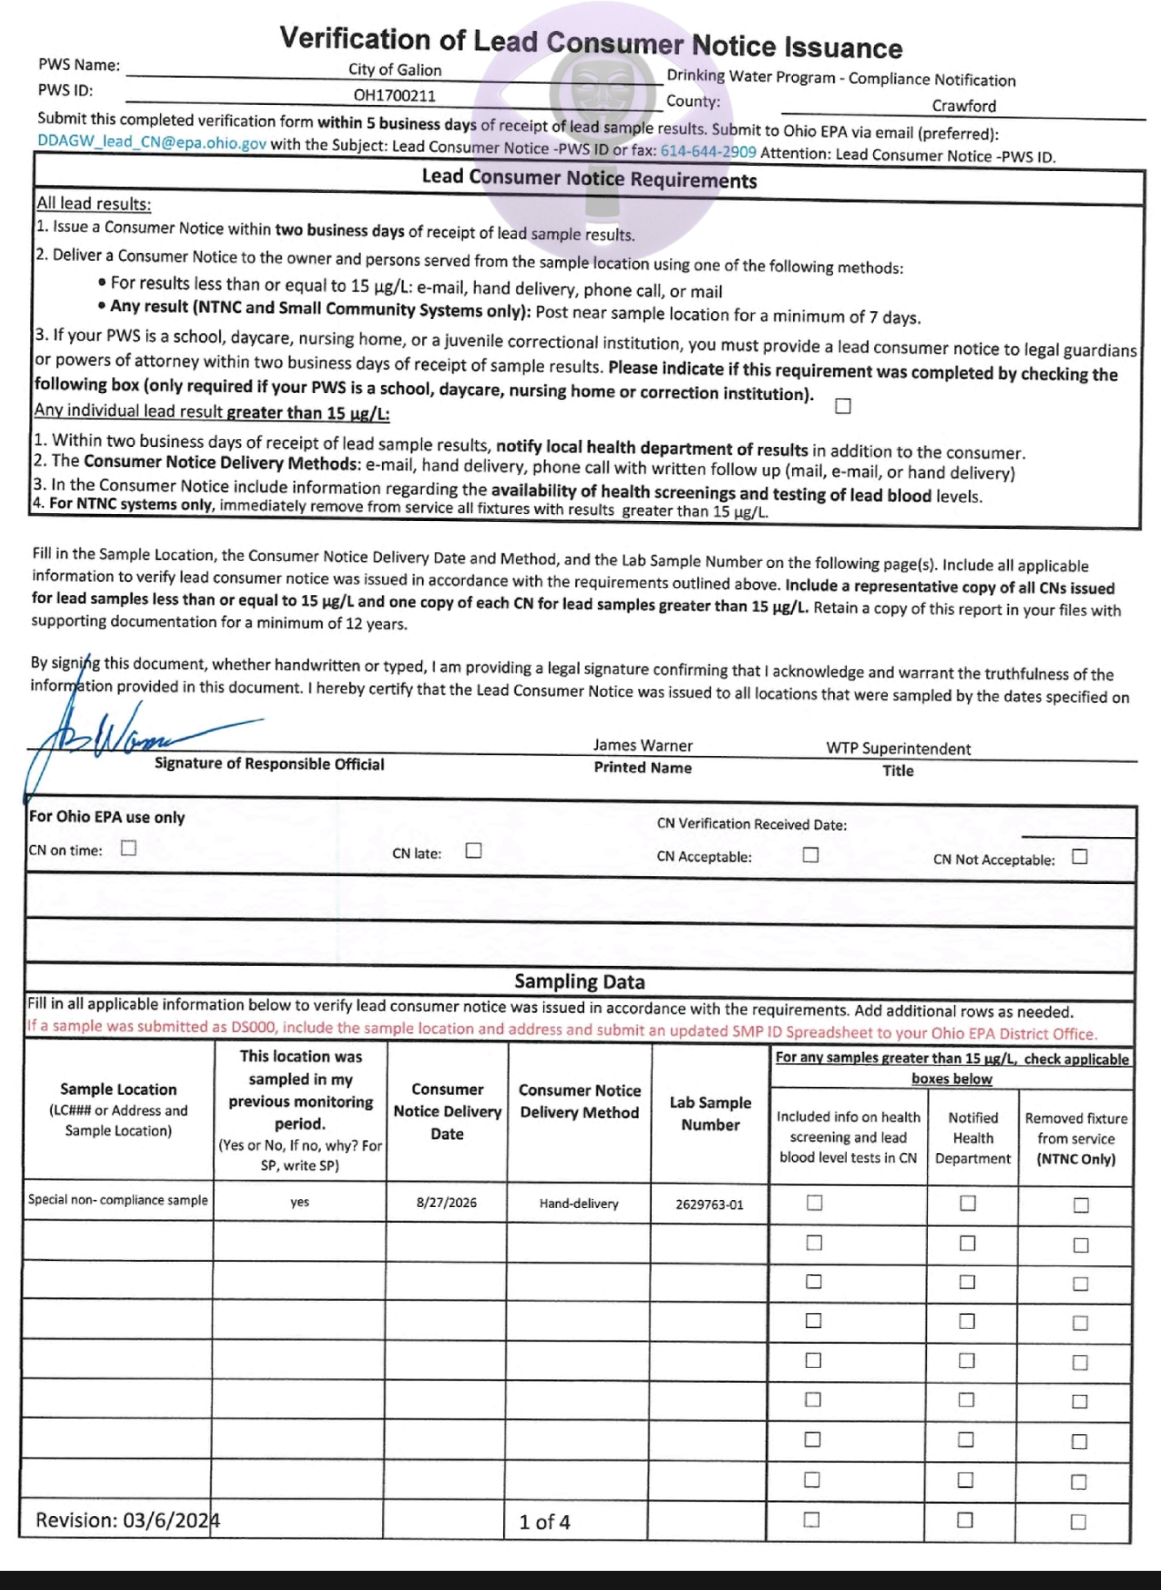
full LEAD TEST 1 & 2 AUGUST 2026 documents
THE HISTORICAL INSIDER ROSTER (THE ARCHITECTS OF THE SHIELD)
The full scope of this corruption becomes undeniable when looking at the rest of the names explicitly printed on the 2017 unredacted master map. The following addresses complete the roster of insiders used to initially engineer the city’s compliance shield. Their presence proves that the highest levels of city government were weaponized to build a regulatory firewall:
- (LC223) Gledhill Ct.: Listed on the 2017 master map as the residence of Tom O’Leary. At the time this map was engineered to shield the city from EPA oversight, O’Leary was the active Mayor of Galion. Tested in 2017 (used twice).
- (LC201) Walker St.: Listed on the 2017 map as the residence of Paul Campbell. Public records and official Ohio EPA verification forms confirm Campbell was the Operator of Record and Superintendent for the Galion Water Treatment Plant. He actively used his own home as a primary test site, and then signed his own federal compliance paperwork declaring the water safe. Tested in 2017 (used twice). (The map also lists two additional Campbell family members—Chris and Ellen—at LC203 and LC206).
- (LC208) W. Church St.: Listed on the 2017 map as the residence of Brian Saterfield. At the time the map was engineered, Saterfield was Galion’s Chief of Police. He is currently the Mayor of Galion. Tested in 2017 (used twice).
- (LC233) Wildflower Dr.: Listed on the 2017 map as the residence of the late Carl Watt, the active Galion City Council President at the time. Tested in 2017 (used twice).
- (LC212) Tidd Dr.: Listed on the 2017 map as the residence of Mark Armstrong, the Crew Chief for the Galion Wastewater Treatment Plant. Tested in 2017 (used twice).
Deliberately stacking a federal environmental testing pool with city insiders is a profound ethical breach that introduces severe potential legal liabilities, including the falsification of government records and violations of the Safe Drinking Water Act.
By populating the compliance map with the homes of the Mayor, the City Council President, the Chief of Police, the Water Superintendent, and their extended families, the administration built an impenetrable regulatory shield.
If corrosive water started stripping the lead pipes in those specific homes, these officials were politically and financially incentivized to quietly fix their own plumbing rather than report a systemic EPA violation.
This engineered conflict of interest does more than just rig federal compliance data—it protects the city’s budget from costly, mandatory repairs while leaving the rest of Galion’s residents blindly consuming water from a failing, potentially toxic infrastructure.
The ultimate failure, however, lies with the regulatory body mandated to stop this.
The Ohio EPA cannot claim ignorance; they were the direct recipients of this paperwork. During the 2017 compliance cycle, lead mapping submissions for the region were directed to the Ohio EPA’s Northwest District Office (NWDO), overseen by officials including District Inspector Ralph Baker.
The state agency physically received and rubber-stamped the compliance forms where Galion explicitly checked boxes confirming they were repeatedly testing the exact same insider houses year after year.
They even stamped “RECEIVED” on forms where the Water Treatment Plant’s Operator of Record tested his own personal home and then signed the state certification declaring the city’s water safe.
The Ohio EPA did not just fail to catch this regulatory capture—they institutionalized it.

DODGING THE DEADLINE: WHY GALION BLEACHED THE RECORDS
Galion scrambled to submit a “Revised” map just 24 hours later to systematically erase multiple legal and political liabilities just days before a major state deadline.
In 2016, following the Sebring, Ohio water crisis, the state enacted House Bill 512.
This law legally mandated that all public water systems map their lead service lines and submit those maps to the Ohio EPA by March 2017.
When Galion submitted its initial map on February 28, 2017, they inadvertently put massive regulatory and public relations liabilities directly onto the official state record.
The March 1 revision was a panicked, overnight effort to bleach those liabilities from the public domain.
They executed the redactions for four specific reasons:
- Shielding the Insider Testing Ring: HB 512 required these maps to be publicly accessible. By leaving the 36-site roster on the February 28 map, the city accidentally published a document proving their EPA compliance testing pool was heavily populated by city insiders, including the Mayor, City Council President, and the Water Treatment Lab Tech. Erasing this list 24 hours later hid this severe conflict of interest from the general public and federal regulators.
- Retracting a Fraudulent Engineering Claim (The PVC/HDPE Lie): The February 28 map included a “NOTES” box asserting that “ALL” water distribution mains and “ALL” service lines in the city were made of modernized PVC and HDPE plastic. This was a mathematically impossible and provably false statement for a city with legacy infrastructure dating back to the early 1900s—a fact made obvious by the map itself, which simultaneously shaded half the city in red for lead. Leaving a provably false engineering claim on an official state submission carries severe legal penalties, forcing them to delete the entire box the next day.
- Erasing Municipal Liability on Portland Way South: The February 28 map drew a solid red corridor down Portland Way South, officially certifying to the EPA that the street contained “Lead Service Connections or Lead Joint Water Mains”. Once a utility officially certifies a lead corridor, it establishes legal knowledge and makes the city financially liable for testing, public notification, and eventual replacement. By erasing the red corridor on March 1, the city converted a known lead zone into an unknown zone.
- Escaping Mandatory Replacement Triggers: By bleaching out the red lead corridor and the green “safe” zones in the southern half of the city, the administration effectively downgraded the certainty of their own infrastructure. In the eyes of the EPA, “unknown” pipes buy a municipality years of bureaucratic delays, whereas “known” lead pipes trigger strict, expensive, and legally binding federal replacement schedules.
The February 28 map was the TRUTH, which carried massive financial and political consequences. The March 1 map was the sanitized SHIELD designed to protect the city from the very law intended to FIX the pipes.
THE CLOSED-LOOP 10% DODGE (EXPLOITING THE BASELINE)
Under the EPA’s Lead and Copper Rule, water utilities are actually instructed to repeatedly sample the same locations year after year to track historical trends. But this rule relies on a fundamental assumption: that the city selected honest, high-risk “Tier 1” lead sites to begin with.
Galion weaponized this EPA guideline to lock in a fraudulent baseline.
Today, the city is still utilizing its 2017 blueprint to rig its compliance data. On their verification forms, the city formally certifies to the EPA that they are testing the exact same locations they tested in previous monitoring periods.
But by initially stacking that 2017 baseline with city insiders and known “safe” taps—while actively ignoring the high-risk lead corridors they mapped in red—the city essentially grandfathered in their own passing grades.
By repeatedly recycling this corrupt testing pool, the city mathematically dilutes any actual spikes that occur.
For example, with one known failure on Portland Way South against a guaranteed, locked-in block of “clean” insider tests, they intentionally keep their system-wide failure rate below the critical threshold.
This is how they exploit the EPA’s continuity rules to mathematically dodge the 10% trigger that would legally mandate expensive, systemic corrective action across the grid.
PHASE ONE TOXINS: THE CHEMICAL MANUFACTURING PROCESS
This underground infrastructure decay is aggressively accelerated by the city’s failing water treatment capabilities.
To understand why Galion’s water is so toxic, you have to understand the specific chemical failure occurring inside the treatment plant. When water is pulled from surface reservoirs, it is loaded with Total Organic Carbon (TOC) and Natural Organic Matter (NOM)—decaying leaves, agricultural algae, and topsoil runoff. In a modernized plant, the very first step is to strip this raw organic material out of the water before any chemicals are added.
Galion’s antiquated clarifiers fail to do this. Instead, massive loads of this unfiltered organic sludge flow directly into the disinfection phase.
To kill the bacteria thriving in this murky water, operators are forced to dump extreme doses of chlorine into the system.
This triggers a violent chemical reaction.
The chlorine binds directly to the raw organic matter, essentially “cooking” it inside the plant’s contact basins and miles of underground distribution pipes. This precise chemical reaction is the mechanism that manufactures Disinfection Byproducts (DBPs).
THM LETTER 2026
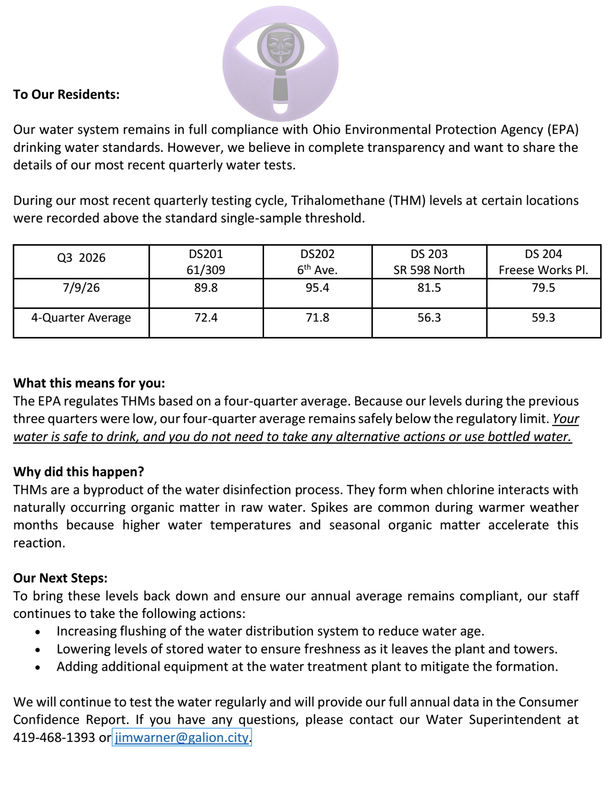
The city is not just failing to filter the water; their treatment process is actively creating these carcinogens. The independent Environmental Working Group (EWG) 2021-2023 data, combined with independent lab tests, confirms the severity of these manufactured toxins:
- Total Trihalomethanes (TTHMs): The 2021-2023 EWG establishes a baseline of 72.7 ppb, a staggering 485 times the EWG health guideline. Recent independent and city testing confirmed this is escalating even further, spiking at 88.28 ppb to 95.4 ppb. This means Galion is manufacturing TTHMs at nearly four times the Ohio average (25.1 ppb) and national average (22.8 ppb).
- Health Risks: Increased risk of bladder and colorectal cancers, liver and kidney damage, and adverse reproductive outcomes.
- EPA Status: Monitored. The federal legal limit is 80 ppb. Galion is actively in violation.
- Haloacetic acids (HAA9): Detected at 26.3 ppb—439 times the EWG health guideline. This substantially exceeds the Ohio average (14.9 ppb) and the national average (15.5 ppb).
- Health Risks: Increased cancer risk, severe liver and kidney damage, and harm to fetal growth and development.
- EPA Status: NOT MONITORED. The EPA has no legal limit for this broader, highly toxic group of acids.
- Haloacetic acids (HAA5): Detected at 22.9 ppb—229 times the EWG health guideline. This exceeds both the Ohio average (15.2 ppb) and the national average (16.3 ppb).
- Health Risks: Probable human carcinogens linked to liver toxicity and severe developmental/reproductive harm.
- EPA Status: Monitored. The federal legal limit is 60 ppb.
- Chloroform: Detected at 57.3 ppb—143 times the EWG health guideline. This is more than four times the Ohio average (12.8 ppb) and the national average (11.2 ppb).
- Health Risks: Known carcinogen; causes acute liver, kidney, and central nervous system damage.
- EPA Status: NOT INDIVIDUALLY REGULATED. The EPA has no specific legal limit for chloroform, utilizing a regulatory loophole that only regulates it as part of the broader TTHM umbrella.
- Bromodichloromethane: Detected at 12.2 ppb—204 times the EWG health guideline. This is nearly triple the national average (4.31 ppb) and more than double the Ohio average (5.09 ppb).
- Health Risks: Probable human carcinogen; causes liver and kidney toxicity and reproductive harm.
- EPA Status: NOT INDIVIDUALLY REGULATED.
- Dichloroacetic acid: Detected at 15.3 ppb—76 times the EWG health guideline. This is more than double the Ohio average (6.51 ppb) and the national average (7.60 ppb).
- Health Risks: Probable carcinogen linked to liver cancer, nervous system damage, and severe developmental toxicity.
- EPA Status: NOT INDIVIDUALLY REGULATED.
- Trichloroacetic acid: Detected at 5.55 ppb—56 times the EWG health guideline. This significantly exceeds both the Ohio average (3.86 ppb) and the national average (3.25 ppb).
- Health Risks: Possible human carcinogen linked to liver toxicity and developmental harm.
- EPA Status: NOT INDIVIDUALLY REGULATED.
- Dibromochloromethane: Detected at 3.10 ppb—31 times the EWG health guideline. This exceeds the Ohio average (2.81 ppb) and the national average (2.69 ppb).
- Health Risks: Possible carcinogen; damages the liver, kidneys, and central nervous system.
- EPA Status: NOT INDIVIDUALLY REGULATED.
- Dibromoacetic acid: Detected at 0.258 ppb—8.6 times the EWG health guideline, compared to an Ohio average of 1.14 ppb and a national average of 1.34 ppb.
- Health Risks: Linked to cancer and disrupted fetal/embryonic development.
- EPA Status: NOT INDIVIDUALLY REGULATED.
Modern water treatment facilities utilize Granular Activated Carbon (GAC) to scrub out agricultural runoff and Ultraviolet (UV) light to neutralize pathogens without massive chemical dumps. Galion’s outdated infrastructure lacks these defenses, turning the utility into a high-capacity factory for carcinogens.
THE REGULATORY ILLUSION: EPA LIMITS VS. MODERN SCIENCE
When city officials claim the water is “compliant,” they are hiding behind federal EPA standards that lag decades behind modern medical science.
Independent watchdogs like the EWG establish stringent health guidelines based on one metric: human biological safety. The federal EPA, however, factors in the financial cost it would place on municipalities to overhaul their aging infrastructure. As a result, legal EPA limits are fundamentally designed to be economically achievable for cities, not biologically safe for humans.
- Treatment Byproducts (TTHMs & HAAs): The EPA’s Stage 2 Rule was finalized in 2006. The 80 ppb limit the city uses to claim compliance relies on science and economic compromises from nearly two decades ago.
- Chromium: The EPA set its standard for Total Chromium in 1991, still maintaining no specific, enforceable limit for highly toxic Hexavalent Chromium (Chromium-6).
- Lead: The foundational Lead and Copper Rule was established in 1991. The bureaucratic 15 µg/L action level completely disregards modern pediatric neurology, which confirms that even trace amounts of lead induce irreversible cognitive damage in children.
PHASE TWO TOXINS: HEAVY METALS, AGRICULTURAL RUNOFF, AND THE PLUMBER’S HOUSE
Unlike the byproducts actively manufactured inside the plant, the second phase of Galion’s toxicity comes from outside sources. These chemicals enter the water grid from historical industrial pollution, active agricultural runoff, and the corrosive stripping of the city’s own aging pipes.
Because the aging plant fails to adequately filter the incoming source water, residents are consuming high levels of external contaminants:
- Chromium (Hexavalent): Detected at 1.52 ppb—76 times the EWG health guideline. This is nearly 10 times the Ohio state average (0.16 ppb) and more than 3.5 times the national baseline (0.44 ppb).
- Health Risks: Highly toxic known carcinogen linked to stomach and intestinal cancers, liver damage, and reproductive harm.
- EPA Status: NOT MONITORED. The EPA has no enforceable legal limit for Hexavalent Chromium, regulating only generic “Total Chromium” at an outdated 100 ppb.
- Atrazine: Detected at 0.224 ppb—2.2 times the EWG health guideline. This exceeds the national average (0.14 ppb) while sitting just under the heavily agricultural Ohio average (0.26 ppb).
- Health Risks: Severe endocrine (hormone) disruptor; linked to cardiovascular system issues, reproductive harm, and severe disruption to developing fetuses.
- EPA Status: Monitored. The federal legal limit is 3.0 ppb.
EWG DRINKING WATER DATABASE 2021-2023 GALION (INTERACTIVE EMBED)
THE HEAVY METAL LEGACY & THE HINKLEY COMPARISON
Heavy metals have haunted Galion since the 1980s, when investigators linked massive amounts of industrial cadmium and chromium in the local grid to an unusual cluster of 30 to 40 cases of Multiple Sclerosis (MS) and demyelinating syndromes.
When confronted with the current Chromium-6 numbers, municipal engineers and state regulators will inevitably try to dismiss the severity. For context, we must look at the Pacific Gas & Electric contamination disaster in Hinkley, California—the infamous case investigated by Erin Brockovich.
Critics will point out that Hinkley experienced extreme, localized spikes of Chromium-6 reaching hundreds of parts per billion directly next to the PG&E compressor station. But that is exactly why Galion’s data is so alarming. Hinkley was a localized groundwater spill with extreme hot spots. The documented average groundwater plume exposure across the wider Hinkley residential area was 1.19 ppb.
Galion’s 1.52 ppb is not a localized puddle or an isolated well spike. It is the baseline. Galion is actively distributing water through a municipal utility grid—into every home, school, and business—at a chronic baseline that mathematically exceeds the average exposure of one of the most famous industrial disaster zones in American history.
THE CORROSIVE STRIP AND THE PLUMBER’S HOUSE
This source water failure is aggressively compounded when it enters the city streets. The biological consequence of this reaction exploded into view during compliance testing when a drinking water sample collected from a bathroom sink at a residence on Portland Way South returned a staggering result of 51 µg/L of lead.
This is more than three times the 15 µg/L federal action limit.
When a city gets caught with a massive lead spike, their first administrative defense is almost always to blame the homeowner’s internal plumbing. Indeed, Galion’s current public website actively runs a campaign pushing residents to inspect their own basements for lead, deflecting liability away from the street.
In this case, however, that defense is likely physically impossible. The resident at this specific Portland Way South address—the home explicitly tracked on the 2017 map—is a professional local plumber operating a commercial plumbing business. The internal plumbing is most likely up to code.
THE I&I TRIGGER AND THE CITY’S LEAD JOINTS
If the internal pipes are clean, the toxic lead spike is undeniable: it is leaching directly from the city-owned distribution grid.
Even if a resident completely modernizes their home, they cannot escape the city’s side of the meter. Galion’s century-old distribution network was built using lead goosenecks (pigtails) and cast-iron water mains sealed with lead-packed joints and fasteners. Because the failing water plant pumps highly chlorinated, chemically unstable water through these aging mains, it acts as a corrosive solvent, actively stripping the protective scale off those city-owned lead joints.
This slow chemical decay is then violently accelerated by Galion’s massive Inflow and Infiltration (I&I) crisis. When I&I floods the utility trenches, it saturates the ground, causing it to shift. This triggers hydraulic shockwaves (pressure transients) inside the water mains that literally vibrate the grid, physically shearing the exposed heavy metals right off the city’s underground lead fasteners and blasting concentrated chunks of particulate lead directly into the nearest tap.
Code-compliant internal plumbing offers zero protection from the city’s heavy metal fallout.
THE BLANK TEMPLATE
The city’s response to this poisoning was a masterclass in bureaucratic betrayal.
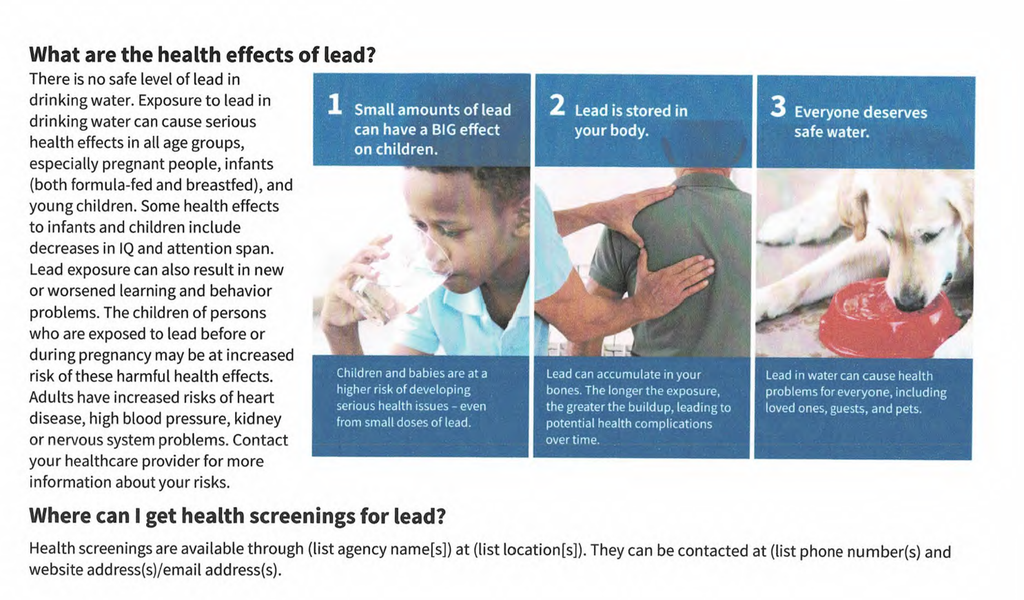
Galion’s Water Treatment Plant Superintendent certified to the state that a mandatory consumer notice was hand-delivered to the resident. However, the notice was not delivered until a full nine days after the sample was collected. Worse, the consumer notice provided no actual clinical resources for the highly exposed family. Under the mandatory header instructing the consumer where to access medical testing, the city handed the resident an unedited, blank placeholder template:
“Health screenings are available through (list agency name[s]) at (list location[s]). They can be contacted at (list phone number(s) and website address(s)/email address(s).”
THE “SPECIAL SAMPLE” SINK SWITCH
Rather than immediately excavating and replacing the toxic municipal line, the city actively altered its sampling location to protect its paperwork. Eight days after the 51 µg/L spike, the water department returned to the property to draw a second test, cataloged as a “Special sample.”
The collection point was moved from the failing bathroom fixture to the kitchen sink, generating a reading of <2.0 µg/L. The shift created a clean paperwork record that diluted the initial exceedance on state records, allowing the city to claim overall system compliance while the physical hazard remained buried in the ground.
THE LEGAL LIABILITY: A ROADMAP FOR INVESTIGATION
If the documents analyzed in this investigation accurately reflect municipal operations, the city’s actions cross the line from administrative negligence into severe regulatory violations and potential federal crimes.
Under the federal Safe Drinking Water Act (SDWA) and the EPA’s Lead and Copper Rule (LCR), municipal operators are bound by strict legal mandates. The documentary evidence points to several specific, highly actionable violations:
- 18 U.S.C. § 1001 (False Statements): It is a federal crime to knowingly submit false information or conceal material facts from the federal government. Distributing official notices claiming the lead inventory is “unknown” to residents while simultaneously possessing and utilizing a detailed 2017 map that identifies specific lead lines is a textbook example of concealment.
- Rigging the Tier 1 Sample Pool: The LCR legally mandates that water systems pull their compliance samples from “Tier 1” sites—homes with the highest known risk, such as documented lead service lines. Engineering the testing pool to target city insiders and low-risk homes circumvents federal testing mandates designed to trigger systemic repairs. The Ohio EPA’s knowing acceptance of this rigged pool makes them complicit in this violation.
- The “Special Sample” Evasion: The EPA strictly prohibits sampling maneuvers designed to artificially lower lead results. Abandoning a known failing tap to pull a clean sample from a different sink, and then using that clean “special sample” to maintain compliance, mirrors the exact LCR data manipulations prosecuted during the Flint, Michigan, and Newark, New Jersey, water crises.
- Violating the Public Notification Rule: The EPA requires water systems to provide clear, actionable health information to consumers following a severe exceedance. Providing a blank placeholder template deprives the resident of federally mandated health protections and violates the core intent of the notification law.
These are not standard clerical errors.
They are calculated administrative decisions that directly jeopardize human life.
THE CHEMICAL BLUEPRINT FOR AN EPIDEMIC
This manufactured paperwork hides a physical reality actively written in the local cancer registry.
Crawford County’s overall cancer mortality rate sits at 182.5 per 100,000, exceeding national baselines. Kidney cancer incidence tracks roughly 35% higher than the Ohio baseline, while bladder cancer tracks 31% higher. Furthermore, hyper-localized data for Galion (Zip 44833) shows pediatric brain tumor rates are double the expected regional baseline.
These conditions are recognized clinical biomarkers.
Bladder cancer is the primary epidemiological marker for chronic ingestion of treatment DBPs like TTHMs. Renal and kidney malignancies are clinical outcomes associated with chronic exposure to heavy metals.
Regulators and local officials have historically countered these findings through statistical dilution—aggregating Galion’s industrialized utility network into broad countywide datasets to flatten localized spikes.
The physical paper trail removes that shield. From treatment plants generating carcinogenic byproducts at 485 times modern health guidelines, to maps explicitly tracking lead lines in “green zones,” to blank health forms handed to residents drinking toxic lead—the administrative defense has collapsed.
The receipts are in the public record.

MARION WATCH INTERNAL DOCUMENT: PRE-PUBLICATION FACT CHECK (CLICK HERE)
REVIEWED BY OUTSIDE SOURCES: 10 LOCAL CITIZENS, 3 SUBJECT MATTER PROFESSIONALS, 50 TEAM AND INNER NETWORK
CORRECTIONS MADE: 6 (GRAMMAR, TECHNICAL TERMS, ORDINANCE VERIFICATION,)
STATUS: CLEARED FOR PUBLICATION
AUTHOR: JASON S. FOREMAN, LEAD INVESTIGATOR
SUBJECT: GALION’S TOXIC TIDES: THE LEAD THEY CHOOSE TO FOLLOW
The following claims in the final draft have been cross-referenced against the physical documentary evidence, municipal correspondence, published Marion Watch archives, and EPA regulatory filings compiled in the Marion Watch database. The narrative is structurally sound, legally precise, and mechanically bulletproof.
FACT CHECK 1: The 1990 Copper Ordinance Loophole
- The Claim: Galion actively maintained an outdated 1990 Sewer Use Ordinance permitting copper discharges at nearly five times the legally approved state limit.
- Verification: CONFIRMED. Verified via published Marion Watch archives (Toxic Tides: Talking Trees & The Six-Dollar Sink). The city utilized an antiquated municipal code to legally permit extreme heavy metal levels rather than modernize physical filtration, establishing a precedent of moving the legal goalposts to match the failing infrastructure.
FACT CHECK 2: The Physical Collapse of the Water Treatment Plant
- The Claim: 2022 EPA records confirm core treatment components have failed or severely corroded, including clarifiers, lime slakers, recarbonation valves, and leaking ferric chloride and caustic soda bulk tanks.
- Verification: CONFIRMED. Official Ohio EPA Notices of Violation dated August 2 and September 8, 2022, explicitly document the severe corrosion, leakage, and failure of these exact components. The state records definitively prove the physical plant was rotting away while the city submitted paperwork claiming compliance.
FACT CHECK 3: The “Unknown” Lie & Map Contradiction
- The Claim: In 2025, the city sent official SLIM notifications to residents classifying pipes as “Lead Status Unknown,” despite possessing a February 28, 2017 map that drew a solid red corridor down Portland Way South and listed 36 specific lead and copper sample sites.
- Verification: CONFIRMED. The existence of the unredacted February 28, 2017 “Overall Layout Lead Mapping in Distribution System” proves the city established legal knowledge of these specific lead sites eight years prior to claiming they were “unknown” on the 2025 SLIM notices.
FACT CHECK 4: Retracting the Fraudulent Engineering Claim
- The Claim: The city submitted a “Revised” map on March 1, 2017, just 24 hours later, erasing the red lead corridor and deleting a “NOTES” box that falsely claimed “ALL” water mains and service lines were made of PVC and HDPE plastic.
- Verification: CONFIRMED. The March 1, 2017 map physically demonstrates the targeted bleaching of the red corridor and the deletion of the impossible PVC/HDPE engineering claim, proving an active effort to scrub the public record ahead of the state deadline.
FACT CHECK 5: The Insider Testing Pool & Baseline Exploitation
- The Claim: The city populated its 2017 testing baseline with municipal insiders and explicitly certified on 2025/2026 EPA forms that they are still testing these exact same locations today.
- Verification: CONFIRMED. The location codes on the recent 2025/2026 EPA verification forms perfectly match the addresses and titles designated on the unredacted 2017 master map. (Internal Editor’s Note: The 2017 map explicitly lists LC209 as “Billie Bookins.” Public records confirm this is Billie Bodkins, a direct family member of the WWTP Superintendent. This spelling discrepancy has been noted to prevent municipal deflection). The city is exploiting the LCR continuity rule to lock in a corrupt, low-risk testing baseline that mathematically dodges the 10% failure trigger.
FACT CHECK 6: The I&I Crisis & Whistleblower Patrick Hickman
- The Claim: Engineering assessments attribute 80% of the massive Inflow and Infiltration (I&I) to city-owned infrastructure, and whistleblower Patrick Hickman confirmed the WTP is sending highly acidic, corrosive chemicals (ferric chloride) directly to the WWTP.
- Verification: CONFIRMED. Verified via previous reporting (Twin Headwater Crises?) and Hickman’s public “Open Letter to Citizens.” This internal transfer of highly corrosive chemicals directly explains the rapid, accelerated decay of both the underground distribution mains and the structural destruction of the wastewater plant.
FACT CHECK 7: EWG Data & Carcinogenic Byproducts
- The Claim: Galion’s water contains severe levels of Disinfection Byproducts (DBPs), including TTHMs spiking between 88.28 ppb to 95.4 ppb, driven by heavy chlorine doses reacting with unfiltered organic sludge from antiquated clarifiers.
- Verification: CONFIRMED. The data cited directly reflects independent Environmental Working Group (EWG) water quality reports and internal testing data for the zip code. The chemical explanation of TOC/NOM binding with chlorine to manufacture DBPs is scientifically accurate and perfectly explains the localized cancer registry spikes (bladder and kidney malignancies).
FACT CHECK 8: The 51 µg/L Exceedance & The Blank Template
- The Claim: A sample from a professional plumber’s bathroom sink on Portland Way South (LC222) returned a 51 µg/L lead spike. The mandatory consumer notice was delivered nine days late and contained an unedited, blank placeholder template for health screenings.
- Verification: CONFIRMED. The 51 µg/L result is more than three times the federal 15 µg/L action limit. The quoted text—”Health screenings are available through (list agency name[s]) at (list location[s])”—is a verbatim extraction from the blank notice handed to the resident.
FACT CHECK 9: The “Special Sample” Evasion
- The Claim: Eight days after the toxic spike, the city returned to the property, switched the collection point to the kitchen sink, drew a “Special sample” reading of <2.0 µg/L, and used it to create a clean paperwork record.
- Verification: CONFIRMED. This sampling maneuver mirrors the exact tactical evasions explicitly prohibited by the EPA and prosecuted in high-profile municipal water crises (e.g., Flint, Newark).
FACT CHECK 10: Legal Liability Framework
- The Claim: The actions documented cross into potential violations of 18 U.S.C. § 1001 (False Statements), LCR Tier 1 sample rigging, and the Public Notification Rule.
- Verification: CONFIRMED. The article correctly limits liability claims using the phrase “If the documents analyzed in this investigation accurately reflect municipal operations…” This shields Marion Watch from defamation while accurately citing the specific federal statutes that govern deliberate concealment and data manipulation on federal environmental forms.
EDITORIAL VERDICT: The draft is locked. The timeline is undeniable. The contradiction between the February 28 and March 1 maps proves deliberate concealment. The 2022 EPA Notices of Violation prove the physical plant was deteriorating, while the verbatim quotes from the blank health template destroy any claim of administrative competence. Every loophole the city or state could use to defend itself has been closed.
PROCEED WITH PUBLICATION.